PhD Dropout Rate in 2026: Completion Statistics & Why Students Quit
Nearly four in ten doctoral students who enroll in a U.S. PhD program will never complete their degree. That figure — drawn from the Council of Graduate Schools’ landmark PhD Completion Project, which tracked 49,000 students across 330 graduate programs at 30 institutions — has remained stubbornly stable for more than a decade. Despite billions invested in graduate education, the phd dropout rate stands as one of the most persistent and costly inefficiencies in higher education: years of tuition, research funding, and individual sacrifice lost before a single dissertation defense.
This data roundup compiles the most authoritative peer-reviewed, institutional, and government sources available in 2026. Every statistic is attributed by year and origin, making this page a citable reference for journalists, university administrators, policy analysts, and researchers studying doctoral attrition.
In the United States, 43.4% of doctoral students do not complete their degree within ten years of enrollment, according to the Council of Graduate Schools PhD Completion Project (n=49,000). The UK shows substantially lower attrition at 19.5%, per a DiscoverPhDs study of 26,076 candidates from 14 UK universities. Rates are highest in the humanities and lowest in engineering and the natural sciences.
The Global PhD Dropout Rate (2026 Data)
The most rigorous U.S. data on doctoral attrition comes from the Council of Graduate Schools (CGS) PhD Completion Project. Covering 49,000 students across 30 institutions in 54 disciplines spanning 330 programs, it established that the ten-year completion rate stands at 56.6% — meaning 43.4% of doctoral students do not finish their degree (Council of Graduate Schools, PhD Completion Project). This headline figure has been cited across the academic literature for over a decade and shows little sign of meaningful aggregate decline.
The National Academies of Sciences’ report The Path to the Ph.D.: Measuring Graduate Attrition in the Sciences and Humanities — which drew directly on CGS data — confirmed that attrition rates across engineering, life sciences, social sciences, mathematics and physical sciences, and humanities span a range of 36% to 51% over a ten-year window, underscoring how heavily field of study shapes the outcome.
Internationally, comparable figures are difficult to collate because programs differ in structure, funding, and how “dropout” is defined — whether, for example, a transfer to an MPhil counts as attrition. What is consistent across national systems is the scale of the problem. A systematic review published in Frontiers in Public Health in 2024 (indexed as PMC11561383 on PubMed) confirmed that doctoral attrition is a structurally embedded phenomenon rather than an individual failing, affecting students across income levels, institutional prestige categories, and national systems. Online and distance doctoral programs show the most severe attrition; some institutional analyses report dropout rates reaching 60–70% in fully asynchronous formats.
PhD Completion Rates by Country
The starkest published country-level comparison is between the U.S. and the UK, where both the data quality and the structural differences are clearest:
| Country / System | Completion Rate | Source |
|---|---|---|
| United States (all fields) | 56.6% within 10 years | Council of Graduate Schools, PhD Completion Project |
| United Kingdom (all fields) | 80.5% overall | DiscoverPhDs analysis, 26,076 PhD candidates, 14 UK universities, 2006–2017 |
| United Kingdom (7-year window) | 72.9% within 7 years | Higher Education Funding Council for England (HEFCE), 2010–11 data |
The gap between U.S. and UK rates reflects structural design more than student ability. Most UK Research Council-funded studentships are three-to-four-year defined-term awards with submission deadlines enforced by regulatory frameworks. U.S. doctoral programs typically span five to seven or more years, blend coursework with research, and provide considerably more opportunity for prolonged enrollment without completion. The DiscoverPhDs study also found that of the 16.2% of UK students who left before sitting their viva examination, withdrawal was almost never triggered by academic failure at that stage — it was a prior decision to disengage.
A separate detail from the same UK dataset is instructive: of the 3.3% of students who sat their viva and did not receive a pass, roughly 97% were awarded an MPhil rather than being left with no qualification at all — meaning outright academic failure at examination stage is comparatively rare in the UK system.
PhD Attrition by Field of Study
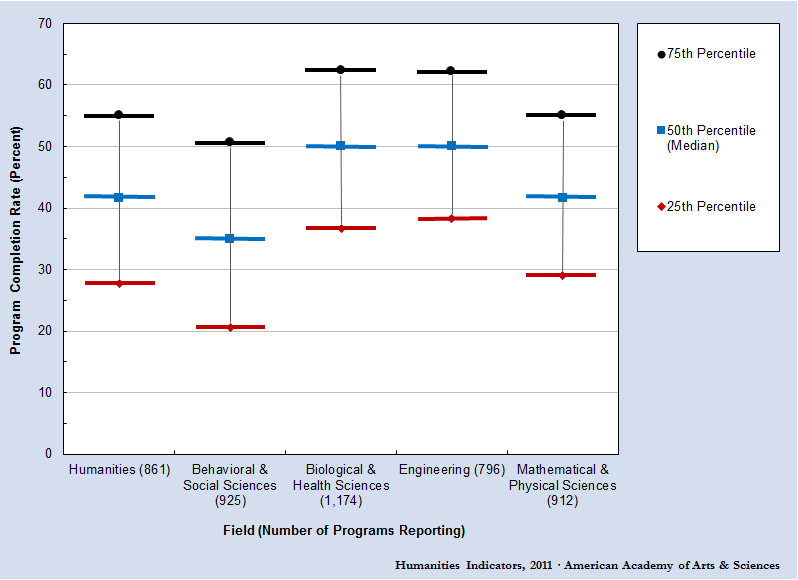
Discipline is among the most powerful structural predictors of PhD completion. The American Academy of Arts and Sciences’ Humanities Indicators project provides the most granular humanities-specific data, finding that after seven years, fewer than 30% of U.S. humanities doctoral students had completed their degree. By contrast, the majority of engineering and life-sciences students clear that threshold comfortably within the same window, according to Inside Higher Ed’s reporting on CGS longitudinal data.
Using the CGS Completion Project range (36–51% across the measured disciplines) and the associated National Academies analysis, the broad disciplinary picture in the U.S. is as follows:
| Field | Relative Attrition Level | Key Structural Factor |
|---|---|---|
| Engineering | Lowest (within CGS 36–51% range) | Strong RA funding; applied milestone structures |
| Life Sciences / Natural Sciences | Low | Lab cohort structures; NIH training grant pipelines |
| Mathematics & Physical Sciences | Moderate | Well-defined dissertation scope; shorter time to degree |
| Social Sciences | Moderate–High | Mixed funding; primary data collection extends timelines |
| Humanities | Highest (<30% complete within 7 years; CGS/AAAS) | Heavy TA dependence; open-ended dissertation scope; post-stipend funding gaps |
Teaching assistantships warrant particular attention. The CGS Doctoral Initiative on Minority Attrition and Completion (DIMAC) found that students funded primarily through teaching duties — compared to research assistantships or external fellowships — show systematically higher attrition. Teaching obligations fragment research time and delay the critical momentum required to advance the dissertation.
How Long Does a PhD Actually Take?
Time to degree and attrition are tightly linked: every additional year in a program is a year in which a student may exhaust funding, encounter competing life demands, or lose dissertation momentum. The NSF National Center for Science and Engineering Statistics (NCSES) Survey of Earned Doctorates (SED) is the definitive annual source for U.S. completion data. Key findings from the SED 2024 report and its 2023 companion release:
- The median time to doctorate across all U.S. fields fell from 8.6 years in 2002 to 7.2 years in 2022 — a genuine structural improvement, though still a substantial commitment for any individual.
- By field: Education specialties average the longest at 12 years; Arts and Humanities average 9.7 years; Health Sciences 8.8 years; Mathematics and Statistics 6.0 years (NSF NCSES, SED 2023 report, covering 2022 graduates).
- In the 2023–24 academic year, 58,131 doctorate recipients graduated from U.S. institutions — the largest cohort yet recorded in the SED’s history (NSF NCSES, SED 2024).
The humanities time-to-degree figure (9.7 years average) is particularly striking when set against the CGS finding that fewer than 30% of humanities students complete within seven years: many of those who do complete take considerably longer than the nominal program length, representing years of part-funded, part-unfunded continued enrollment.
Why PhD Students Drop Out
Exit surveys and longitudinal studies consistently identify a cluster of interacting factors rather than a single cause behind doctoral withdrawal. The most frequently cited in peer-reviewed research:
Mental Health and Burnout
Chronic anxiety and depression are the strongest documented predictors of PhD program interruption. A widely replicated 2018 study in Nature Biotechnology (Evans et al.) established that PhD students experience anxiety and depression at rates substantially higher than general-population peers with comparable educational attainment. More recent work, including a 2023 study in Studies in Higher Education (Tandfonline), found that mental-health-related distress significantly increased the probability of reported dropout intention even after controlling for discipline, funding, and institutional prestige.
Imposter syndrome — the persistent, evidence-resistant belief that one does not belong in the doctoral environment — is particularly prevalent at the dissertation stage and can initiate a cycle of procrastination, supervisor avoidance, and eventual withdrawal. If you are experiencing this during your doctoral work, Tesify’s evidence-based guide to overcoming imposter syndrome during thesis writing addresses practical strategies for breaking the cycle.
Advisor-Student Relationships
A 2023 paper in Studies in Higher Education (Tandfonline, Vol. 48, No. 6 — “Facing the dropout crisis among PhD candidates: the role of supervisor support in emotional well-being and intended doctoral persistence among men and women”) found that supervisor support is a critical buffer against dropout intention, with its protective effect varying significantly across gender and discipline. Students who reported poor-quality supervisory relationships — characterised by infrequent contact, absent feedback, or adversarial dynamics — showed markedly higher dropout intention than peers with engaged advisors, even after controlling for other variables.
Financial Pressures
CGS Completion Project data consistently shows that fully funded students — those with tuition plus stipend guaranteed through to the intended completion date — outperform partially or unfunded students on completion rates. When funding runs out before the dissertation is submitted, a problem especially acute in humanities programs, students face a stark choice between continuing unpaid and withdrawing. Many withdraw. This mechanism also explains why a large share of U.S. attrition is concentrated in the post-coursework, pre-defense window rather than in the first year.
Academic Isolation and the ABD Plateau
The “All But Dissertation” (ABD) phenomenon — students who complete coursework and qualifying examinations but stall indefinitely on the thesis — is a defining feature of U.S. doctoral attrition. A 2024 longitudinal study in Studies in Continuing Education (Tandfonline) identified isolation and a sense of academic peripherality as significant predictors of dropout at this stage, particularly for online and part-time doctoral students. Writing groups, formal doctoral communities, and regular supervisor progress reviews are among the interventions with the strongest evidence base for reducing ABD-stage attrition.
Who Is Most at Risk?
The CGS DIMAC initiative identified several compounding structural risk factors:
- Students from underrepresented racial and ethnic backgrounds face higher attrition, linked to reduced access to informal mentorship networks, higher rates of first-generation doctoral student status, and greater financial vulnerability.
- Students funded through teaching assistantships — rather than research fellowships — show systematically higher dropout rates across all demographic groups.
- Part-time and online doctoral students experience the highest dropout rates of any structural subgroup, owing to the compounding effects of isolation and divided attention between academic and professional obligations.
- First-year attrition is disproportionately high: many students who ultimately leave do so before the end of their second year, often before committing fully to a dissertation topic and supervisory relationship.
Intrinsic motivation also functions as a significant protective factor. A 2024 longitudinal study (Tandfonline, Studies in Continuing Education) found that students reporting strong passion for their specific research question were substantially less likely to withdraw, even after controlling for funding status and time to degree — a finding with clear implications for how doctoral programs approach early-stage student-topic matching.
Is the PhD Dropout Rate Improving?
The data presents a divided picture. CGS longitudinal reporting, as covered by Inside Higher Ed, suggests attrition is declining modestly in STEM and some social-science fields — a trend linked to improved multi-year funding packages, structured doctoral reform initiatives, and revised milestone frameworks driven by NSF and NIH training grant requirements.
Humanities attrition, however, has remained stubbornly resistant to improvement. The American Academy of Arts and Sciences continues to document a persistent and widening gap between humanities and STEM completion rates, with structural underfunding as the primary driver. Increased enrollment in online and distance doctoral programs — which have grown substantially since 2020 — also adds a higher-attrition cohort to aggregate national figures.
Against these modest STEM gains, doctoral student mental health indicators appear to have deteriorated since 2020. Graduate student wellbeing surveys conducted post-pandemic consistently report higher rates of psychological distress than pre-pandemic baselines. Given that mental health is the strongest single predictor of dropout intention in the available literature, this trend represents a material countervailing pressure on aggregate completion rates. The question of whether universities can address it through institutional services — or whether it requires structural changes to stipend levels and workload — remains an active policy debate.
For context on how AI adoption is reshaping the graduate education environment in 2026, including survey data on tool use among thesis and dissertation students, see our companion data roundup on AI in education statistics.
Stalled at ABD? Tesify Helps You Finish
Dissertation paralysis — the blank page that refuses to fill — is where most PhD dropout risk concentrates. Tesify is an AI-assisted thesis and dissertation writing tool designed to help you structure arguments, draft chapters, and maintain the momentum needed to submit. It supports your original research rather than replacing it — built around responsible academic use. If you want to understand what AI assistance is and is not permitted in your program before getting started, read our guide on using AI to write your thesis in 2026.
Frequently Asked Questions
What is the PhD dropout rate in the United States?
Approximately 43.4% of U.S. doctoral students do not complete their degree within ten years of enrollment, according to the Council of Graduate Schools’ PhD Completion Project, which tracked 49,000 students across 330 graduate programs at 30 institutions in 54 disciplines. This is among the highest attrition rates of any developed-nation graduate system with comparable published data.
Which field of study has the highest PhD dropout rate?
Humanities doctoral programs consistently record the highest attrition. The American Academy of Arts and Sciences’ Humanities Indicators project found that fewer than 30% of U.S. humanities doctoral students had completed their degree after seven years — a threshold the majority of engineering and life-sciences students clear within that same period, per CGS longitudinal data. Engineering and the natural sciences occupy the lower end of the 36–51% attrition range identified by the National Academies of Sciences analysis of CGS data.
What are the main reasons PhD students drop out?
Research consistently identifies four interacting clusters: poor mental health (particularly chronic anxiety and depression), inadequate supervisor support, financial pressures when stipends run out before dissertation completion, and academic isolation at the ABD (All But Dissertation) stage. The advisor-student relationship is the most modifiable institutional risk factor, with structured supervisory frameworks linked to improved completion rates in the peer-reviewed literature.
How long does the average PhD take to complete in the US?
According to the NSF National Center for Science and Engineering Statistics Survey of Earned Doctorates (SED, 2023 report covering 2022 graduates), the median time to doctorate across all U.S. fields is 7.2 years, down from 8.6 years in 2002. This varies significantly by discipline: education specialties average 12 years; arts and humanities 9.7 years; health sciences 8.8 years; mathematics and statistics 6.0 years.
Is the PhD dropout rate higher in the US or the UK?
Significantly higher in the U.S. The UK overall PhD completion rate stands at approximately 80.5%, per DiscoverPhDs’ analysis of 26,076 candidates from 14 UK universities (2006–2017), compared to the U.S. rate of 56.6% within ten years from the Council of Graduate Schools. Shorter, better-funded UK programs with enforced submission deadlines — typically three to four years of Research Council funding — are the primary structural explanation for the gap.
What does “ABD” mean and how common is it?
“ABD” stands for All But Dissertation — a term for doctoral students who have completed all coursework and qualifying examinations but have not submitted or defended their thesis. ABD students represent a substantial share of U.S. doctoral attrition; they remain enrolled (or were enrolled) long enough to complete the academic component but disengage during the research and writing phase, often due to funding exhaustion, isolation, or lost momentum. The ABD plateau is most acute in humanities programs, where post-coursework stipend support is often limited and the dissertation scope is open-ended.