
How to Write the Results Chapter of a Dissertation in 2026: Structure, Tables & Reporting Conventions
The results chapter is where your months of data collection finally speak for themselves. Yet more students stumble here than in almost any other section — not because the findings are unclear, but because they do not know how to write a results chapter in a way that is lean, evidence-driven, and free of interpretation. The rule is non-negotiable: present, do not explain. Every sentence in this chapter describes what you found; everything that explains why belongs in the discussion.
This pillar walks you through every component of a strong results chapter: how to sequence findings around research questions or hypotheses, how to report statistics in APA 7, how to design tables and figures that examiners can scan in seconds, and how to present qualitative results with the same rigour you would apply to numbers. Whether your data is Likert-scale responses, regression outputs, or thematic patterns from interviews, the conventions below apply.
What Belongs in the Results Chapter
The results chapter answers one question only: what did your data show? It contains descriptive statistics, inferential test outputs, qualitative themes, or a combination of both — depending on your research design. What it does not contain:
- Explanations of why findings occurred
- Comparisons with prior literature (that is the discussion’s territory)
- Methodological justifications, which belong in your methodology chapter
- Recommendations or conclusions
- Speculation about alternative explanations
If you catch yourself writing “this suggests that…” or “this is consistent with Jones (2020)…”, stop. You have crossed into interpretation. Those sentences belong in the discussion. The diagnostic phrase to watch for is any verb that implies causation or meaning: suggests, explains, demonstrates that, confirms. Verbs of description — revealed, showed, indicated, was higher than — are the language of results.
One point that examiners enforce strictly: negative and null results must appear here. If you tested a hypothesis and found no significant effect, report it — including the exact statistics. Omitting non-significant findings constitutes selective reporting, which undermines the integrity of your research.
How to Structure Your Results Chapter
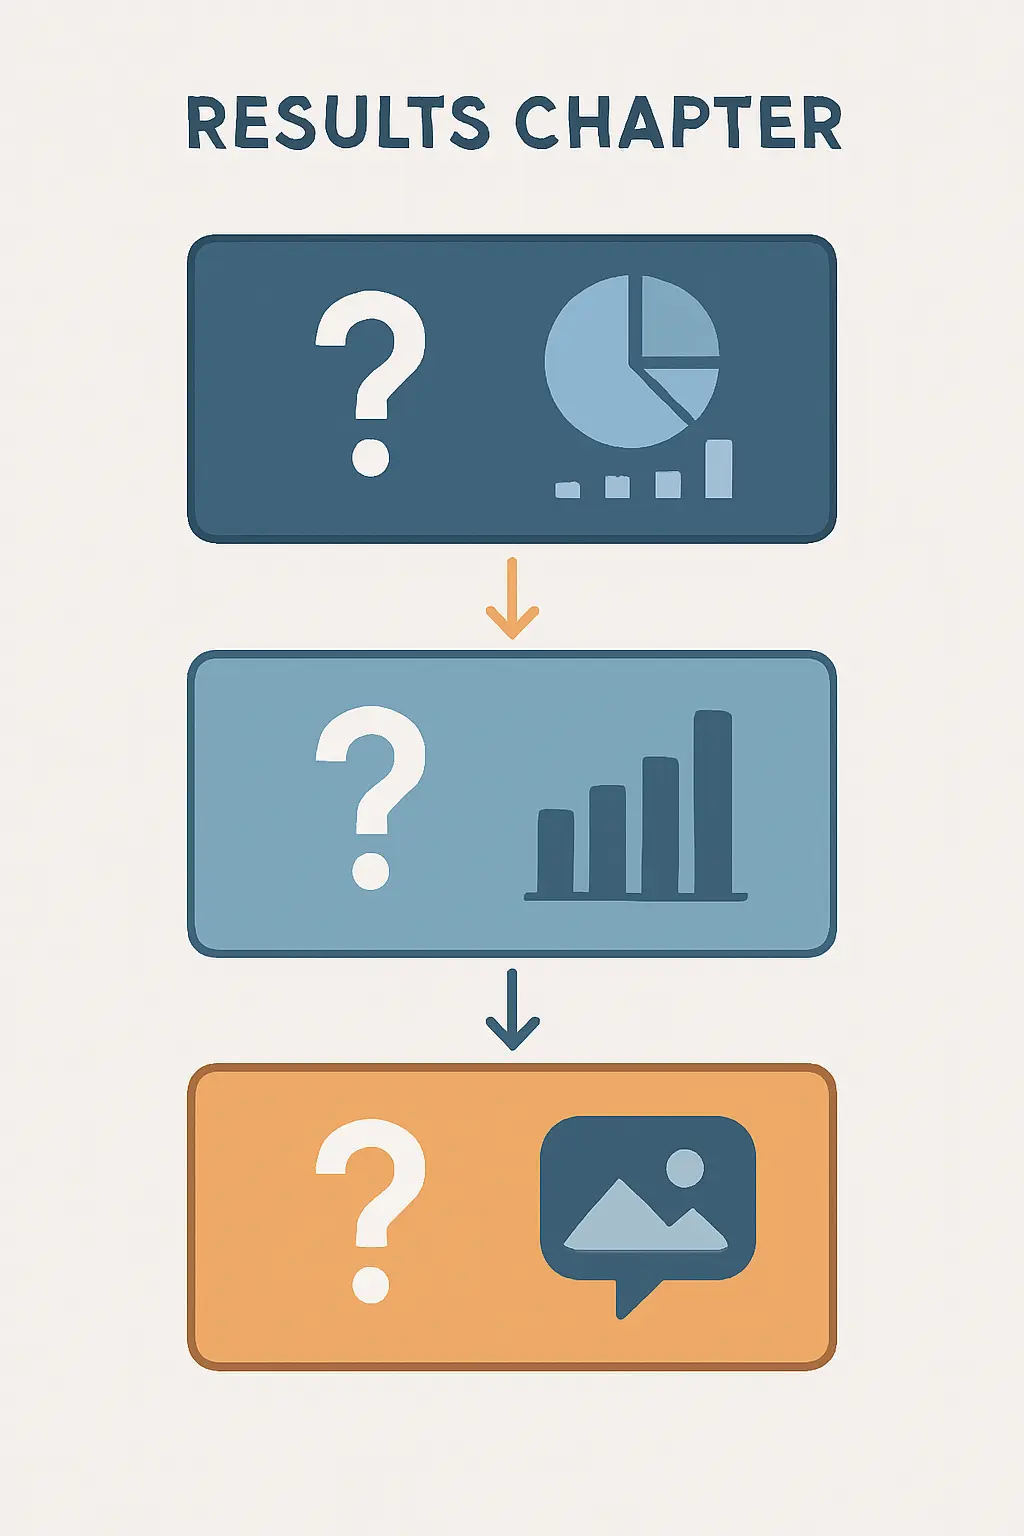
The most reliable and examiner-friendly structure mirrors your research questions or hypotheses exactly. If your dissertation poses three research questions, the results chapter has three clearly labelled main sections, one per question. Examiners can navigate directly to the finding that interests them, and markers rarely penalise a logical, navigable format.
Option 1: Organised by Research Question
Label sub-sections clearly: “Results for RQ1: [the question]”. Within each sub-section, report descriptive statistics first, then the inferential test, then close with a single sentence summarising the direction of the finding — not its meaning or importance.
Option 2: Organised by Hypothesis
State each hypothesis, then report whether it was supported or not supported, followed immediately by the relevant statistics. Avoid “proven” — hypotheses are supported by evidence or they are not; they are never proven in a single study.
Option 3: Organised by Variable Cluster or Theme
In mixed-methods or exploratory studies, organising by variable clusters or thematic domains is appropriate when research questions do not map neatly onto individual analyses. Qualitative dissertations often present themes in descending order of frequency or conceptual centrality.
Whichever structure you choose, open the results chapter with a brief orientation paragraph — two to four sentences — reminding the reader of your design, your sample, and your analytical approach. This is a signpost, not a repeat of the methodology chapter.
Illustrative example — orientation paragraph:
“This chapter presents findings from 214 undergraduate participants across three experimental conditions. Results are organised sequentially by research question. Descriptive statistics are reported for each variable prior to inferential analyses, with a significance threshold of α = .05 throughout.”
APA 7 Statistical Reporting Conventions
APA 7 (American Psychological Association, 2020) specifies precise formatting for every common statistical test. Following these conventions allows readers to replicate your work and lets examiners verify your analysis at a glance. The rules are not arbitrary style preferences — they encode information about precision and uncertainty that specialists expect to find in standardised positions.
Descriptive Statistics
- Use M for mean and SD for standard deviation — both italicised, no periods.
- Report to two decimal places unless greater precision is scientifically warranted.
- Illustrative example: “Participants reported moderate stress levels (M = 3.47, SD = 0.91).”
t-Tests
Format: t(df) = value, p = value, d = Cohen’s d effect size
Illustrative example: “Students in the intervention group scored significantly higher on the post-test than controls, t(112) = 3.24, p = .002, d = 0.61, 95% CI [0.28, 0.94].”
One-Way ANOVA
Format: F(dfbetween, dfwithin) = value, p = value, η² = partial eta-squared
Illustrative example: “There was a significant main effect of condition on exam performance, F(2, 147) = 8.91, p < .001, η² = .11.”
Chi-Square Tests
Format: χ²(df, N = sample) = value, p = value
Illustrative example: “A chi-square test of independence revealed a significant association between enrolment status and programme choice, χ²(3, N = 189) = 12.44, p = .006.”
Pearson Correlation
Format: r(df) = value, p = value
Illustrative example: “Hours of self-directed revision correlated positively with final exam score, r(98) = .54, p < .001.”
Confidence Intervals
Report 95% CIs alongside all effect sizes. Format: 95% CI [lower bound, upper bound] — square brackets, space after the comma, no italics on CI itself.
p Values: the Essential Rules
- Report exact values to two or three decimal places: p = .03, p = .002
- When the value rounds to zero, write p < .001 — never write p = .000
- Omit the leading zero: p = .04, not p = 0.04
- Never write “approached significance” — a result either meets your pre-specified α or it does not
- Italicise p wherever it appears
For how these conventions integrate with APA’s broader paper structure — margins, running head, heading levels — see the full APA 7 formatting guide on this site.
Tables and Figures in APA 7
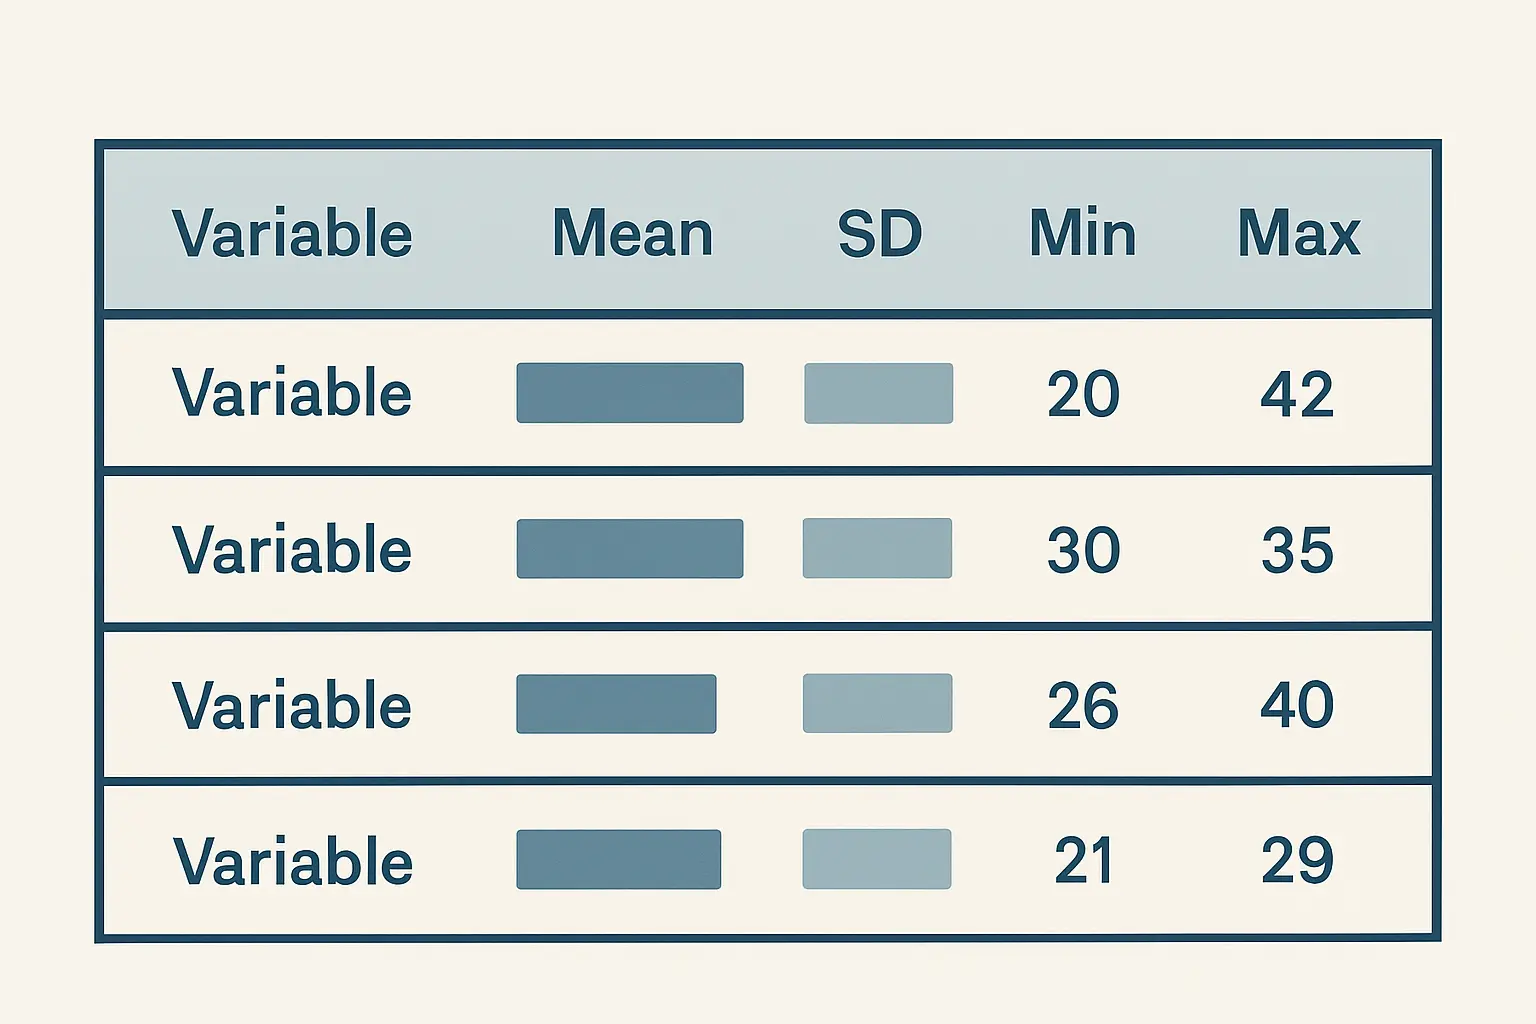
Tables and figures are not decoration — they replace repetitive prose. A well-designed table conveys a pattern in seconds that would take three paragraphs to describe in running text. The general rule: use a table when you have six or more values to report; use prose when you have fewer.
APA 7 Table Rules
- Number tables sequentially: Table 1, Table 2 (never Table 1a or Table 1b)
- Place the “Table N” label above the table, flush left, bold; the title appears on the next line, title case, italicised
- Use horizontal rules only: one above the column headers, one below the column headers, one at the foot — no vertical lines, no internal horizontal rules between data rows
- Place notes below the table with the label Note. (italicised, followed by a period) to define abbreviations or flag probability levels
- Do not duplicate in a table information you have already reported in full prose, and vice versa
Illustrative example — APA 7 descriptive statistics table:
Table 1
Descriptive Statistics for Study Variables (N = 214)
| Variable | M | SD | Min | Max | α |
|---|---|---|---|---|---|
| Academic anxiety | 3.47 | 0.91 | 1.00 | 5.00 | .82 |
| Self-efficacy | 3.91 | 0.74 | 1.80 | 5.00 | .79 |
| Academic performance (%) | 68.20 | 11.43 | 38.00 | 97.00 | — |
Note. Values in this table are illustrative. α = Cronbach’s internal consistency reliability coefficient.
APA 7 Figure Rules
- “Figure N” label sits above the figure, flush left, bold; the descriptive title follows on the next line in italics
- Every figure must be cited in the text before it appears: “Figure 1 displays the distribution of scores by condition.”
- Prefer bar charts or box plots for group comparisons; line graphs for time-series; scatter plots for correlational data
- Avoid 3D effects, excessive gridlines, and colour schemes that lose information in greyscale print
- Axis labels must include the unit of measurement where applicable
Qualitative Results Presentation
Qualitative results require a different but equally rigorous logic. Instead of statistics, you present themes, categories, or narrative descriptions anchored by direct evidence from your data. The specific approach varies by methodology: thematic analysis organises findings into themes and sub-themes; grounded theory uses conceptual categories and their properties; phenomenology presents essences or meaning units drawn from lived-experience accounts.
A Reliable Sequence for Each Theme
- Introduce the theme with a descriptive label and a one-sentence definition of what the theme captures.
- Provide participant evidence via verbatim quotes or field-note excerpts. Use ellipses (…) for omissions and square brackets for inserted clarifications: “I found the [thesis] process isolating.”
- Describe the pattern — how frequently the theme appeared across participants, and whether it varied by subgroup or context.
- Transition to the next theme without interpreting between themes. Interpretation belongs in the discussion.
If you used Braun and Clarke’s reflexive thematic analysis — the approach most UK and Australian programmes now require — the step-by-step guide to thematic analysis covers all six phases and explains how the themes you generated in analysis translate into the structure you present here.
Quote Formatting in APA 7
Short quotes (under 40 words) sit within the paragraph in double quotation marks. Quotes of 40 words or more are formatted as block quotations — indented 0.5 inches from the left margin, double-spaced, no quotation marks — per APA 7 Section 8.27.
Illustrative example — qualitative theme presentation (values and participants are illustrative):
Theme 1: Belonging uncertainty in the first semester
The most prominent theme concerned participants’ sense of not belonging in their academic environment during the opening weeks of study. Participants described persistent self-doubt about their right to be on the programme. One participant reflected: “I kept waiting for someone to tap me on the shoulder and say there had been a mistake.” Another described avoiding seminars for the first month “because I thought everyone else already understood things I didn’t.” This theme appeared across fourteen of the seventeen interviews, with particular intensity among participants who were the first in their family to enter postgraduate education.
Results vs Discussion: Drawing the Line
The boundary between results and discussion is the most consistently blurred line in dissertation writing. The practical test is this: would a different researcher, looking at the same data with no knowledge of the literature, write the same sentence? If yes, it belongs in results. If the sentence requires your interpretive lens, your theoretical framework, or your reading of comparable studies, it belongs in the discussion.
| Sentence | Chapter | Reason |
|---|---|---|
| “The mean score in Group A was 72.4 (SD = 8.2).” | Results | Pure data reporting |
| “This suggests that anxiety mediates the effect of stress.” | Discussion | Causal interpretation |
| “H2 was not supported, p = .47.” | Results | Objective test outcome |
| “This is consistent with Smith and Lee (2023), who found…” | Discussion | Literature comparison |
| “Three themes emerged: belonging, identity, and support-seeking.” | Results | Descriptive categorisation |
Some programmes — particularly in social sciences — permit or even encourage a combined Results and Discussion chapter. If yours does, maintain clear internal sub-headings that mark the shift from “what was found” to “what it means.” The logical discipline still applies; only the chapter boundary changes.
For a detailed treatment of what the discussion chapter must accomplish once the results are reported, the companion pillar on how to write the discussion chapter of a dissertation covers interpretation, engagement with literature, limitation acknowledgement, and implications. For the full sequence of every dissertation chapter from introduction to references, see how to write a dissertation step by step.
Common Mistakes to Avoid
- Presenting every output your software produced. Only include analyses that directly address a research question or hypothesis. Examiners do not need to see the full SPSS output log or every descriptive statistic for every variable.
- Reporting significance without an effect size. A p value tells you whether an effect likely exists in the population; an effect size tells you whether it matters in practice. APA 7 requires both.
- Burying findings in prose that belongs in a table. Six or more means, correlations, or regression coefficients almost always read more clearly in a table than in running text.
- Not referring to every table and figure before it appears. Every table and figure must be introduced in the prose: “Table 3 shows the correlation matrix for all study variables.”
- Omitting non-significant results. If you tested it, report it. A finding of p = .64 is a result. Omitting it misrepresents your data.
- Passive constructions that hide the subject. “A relationship was found” is weaker than “Self-efficacy correlated positively with GPA.” Be specific about which variables related to which.
- Inconsistent decimal places. Choose two or three decimal places and apply that convention uniformly across the entire chapter.
- Starting the chapter without an orientation paragraph. Launching straight into statistics without reminding the reader of the design and sample leaves examiners to reconstruct context they should not have to.
For a step-by-step walkthrough that covers the full workflow from data cleaning to final formatting — with annotated examples for both quantitative and qualitative designs — this detailed guide on tesify.app goes through each stage in sequence.
Frequently Asked Questions
How long should the results chapter be?
Length depends on your research design and the number of research questions. In a typical master’s dissertation, the results chapter accounts for roughly 15–25% of the total word count. A 15,000-word dissertation would therefore have a results chapter of approximately 2,250–3,750 words. Quantitative studies with many variables tend to run longer than qualitative studies with three or four themes, because tables add to the count. Check your institution’s dissertation handbook for any explicit requirements.
Should I use past or present tense in the results chapter?
Use past tense throughout the results chapter, because you are reporting a completed event: “Participants reported…”, “The analysis revealed…”, “RQ1 was supported…”. Present tense is appropriate in the discussion when stating implications or drawing conclusions, but not when describing what your data actually showed. Mixing tenses within the results chapter is a common error that examiners notice.
What is the difference between reporting results and interpreting them?
Reporting describes what the data showed: values, directions, and statistical significance. Interpretation explains what those findings mean in relation to your theoretical framework, prior literature, or real-world context. “Anxiety scores were significantly higher in Group B, t(98) = 2.84, p = .005” is reporting. “This may reflect the greater workload pressure experienced by Group B, consistent with the demands-resources model” is interpretation. The first belongs in results; the second belongs in the discussion.
Do I need to report reliability statistics in the results chapter?
Convention varies by institution. Many dissertations report internal consistency coefficients (such as Cronbach’s alpha) in the methodology chapter alongside descriptions of the instruments. Some supervisors prefer these figures to appear at the start of the results chapter, before the main analyses, so that readers can evaluate the measures before the findings. Ask your supervisor which approach your department expects, and check the programme’s dissertation handbook.
What should I do if my results are not significant or contradict my hypothesis?
Report them honestly and in full. Null results and unexpected findings are valid scientific contributions — they update our collective understanding of what is not true, which is just as valuable as confirming what is. In the results chapter, state exactly what the data showed and include the statistics. The discussion chapter is where you explore why findings may have diverged from expectations — whether due to sample characteristics, measurement constraints, or genuine evidence against the hypothesis. Examiners recognise and reward honest engagement with unexpected outcomes; it demonstrates research maturity.
How do I report multiple regression results in APA 7?
Report the overall model fit first: F(df regression, df residual) = value, p = value, R² = value, adjusted R² = value. Then report each predictor: B (unstandardised coefficient), SE B (standard error), β (standardised coefficient), t(df) = value, p = value, 95% CI [lower, upper]. A regression table listing all predictors is the standard APA 7 format — it is far clearer than reporting each predictor in prose. Refer readers to the table in the running text with a sentence such as “Table 4 presents the full regression results.”